SolarWinds Engineer's Toolset: from a ping sweep to a switch port map
Reviewed 15 September 2026 · Windows · commercial licence, trial available
Engineer's Toolset is not one scanner — it is roughly sixty separate desktop utilities sharing an installer and a launchpad. Five of them do the work covered here: Ping Sweep, MAC Address Discovery, Switch Port Mapper, MIB Scanner and TraceRoute. Together they take you from "which addresses are alive" to "that laptop is on port 2/14 of the third-floor switch".
On this page
What it is (and is not)
The Toolset is a workbench: an engineer opens a tool, points it at something, gets an answer, and closes it. It does not poll continuously, it does not store history, and it does not raise alerts. That is SolarWinds' separate monitoring platform — a different product with a different licence. Confusing the two is the most common reason people are disappointed by the Toolset.
What you are paying for is breadth and the SNMP tooling. No free scanner will tell you which physical switch port a MAC address is behind; Switch Port Mapper will.
- Licence
- Commercial, sold per engineer; time-limited free trial
- Platform
- Windows desktop
- Protocols
- ICMP, SNMP v1 / v2c / v3, DNS, TCP/UDP, syslog, WMI
- Unique strength
- Switch port mapping and SNMP discovery across a range
Prerequisite: SNMP access
Half of the Toolset works with no configuration at all. The mapping half does not. Before you start, on every switch and router you intend to query:
- Enable SNMP and create a read-only community (v2c) or a v3 user with auth and privacy. Read-only is enough for every tool described here.
- Restrict that community to the management subnet or the single workstation running the Toolset with an ACL.
- Prefer SNMPv3 where the hardware supports it. v1 and v2c send the community string in clear text.
- Store the credential once in the Toolset's credential manager rather than retyping it per tool.
An SNMP read community exposes your interface tables, ARP tables, serial numbers and
often the running configuration. Treat it like a password: never leave it as
public on a production switch.
The five tools that matter for discovery and mapping
-
1. Ping Sweep — the inventory layer
The starting point for every job. Enter a range in the Enter ranges to scan field — the syntax is
10.199.1.20-10.199.1.101— or load a saved list with From file…. The Scan for selector filters the output to All, responding hosts only, or non-responding only.Three columns come back: IP Address, Response Time in milliseconds, and DNS. Addresses with no reply read Request timed out in red, which makes free-address hunting trivial — set Scan for to non-responding and you have your list of assignable IPs.
The DNS column is doing quiet work here. Names like
LAB-WSUS-01orLAB-EXC2003-DCidentify server roles before you have touched the host, and an alive address with no DNS name on a managed subnet is exactly the anomaly worth chasing.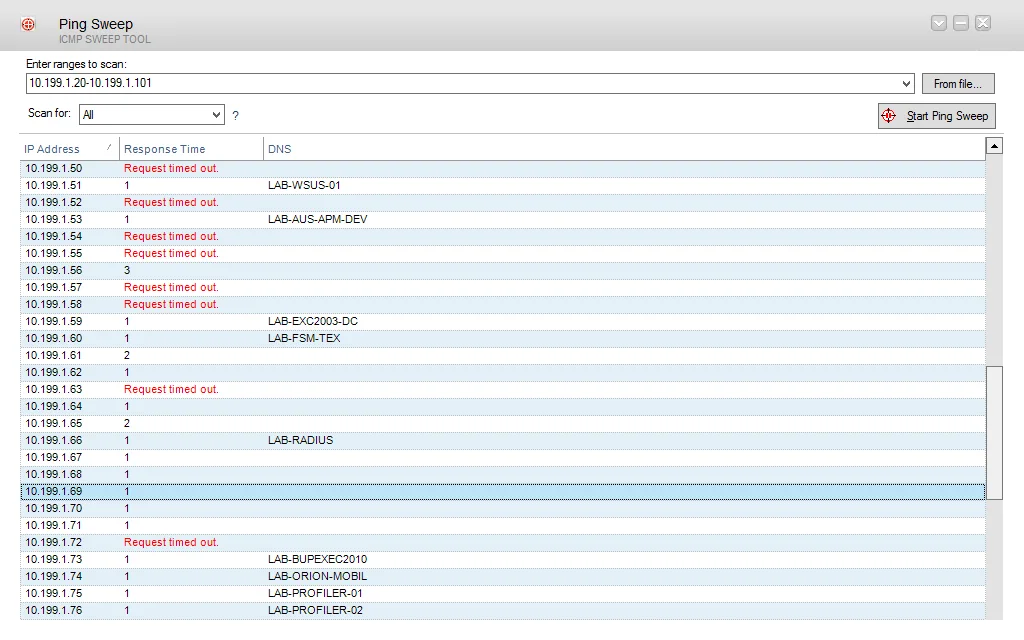
Ping Sweep across a /24 slice. Screenshot: solarwinds.com. -
2. MAC Address Discovery — identity for each address
An IP address is a lease; a MAC address is the device. MAC Address Discovery takes a local subnet and returns IP Address, MAC Address, DNS and Network Card Manufacturer for every host it can reach.
Set the Local Subnet selector, press Discover MAC Addresses, and the table fills. The status line reports the total, for example MAC Address Discovery Complete. 24 addresses.
The manufacturer column is the interesting one. An OUI resolving to
VMWARE, INC.tells you the host is a virtual machine; a consumer phone or IoT vendor appearing on a server VLAN is an incident. This output is also the input for the next step — Switch Port Mapper needs MAC addresses to correlate against the switch's bridge table.Run it from inside the VLAN.MAC discovery is ARP-based, so it only sees the broadcast domain you are attached to. Scanning a remote subnet returns the router's MAC for every host, which is correct and useless. Use Export to keep each subnet's results.
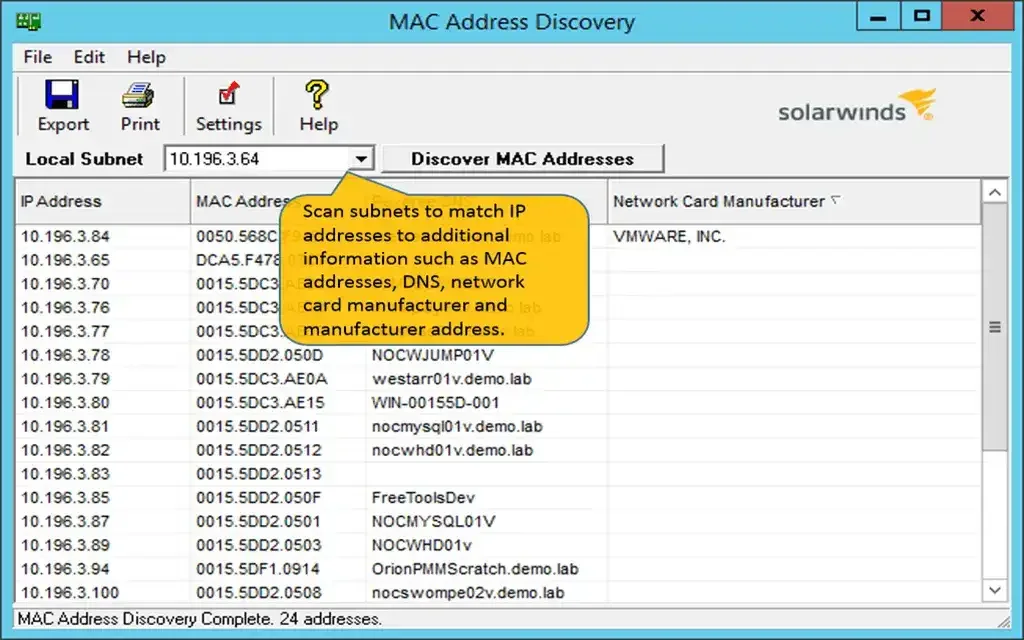
MAC Address Discovery with Export, Print and Settings on the toolbar. Screenshot: solarwinds.com. -
3. Switch Port Mapper — the reason to buy the Toolset
Subtitled What's connected where?, and that is exactly the job. Give it a switch's management IP and an SNMP credential; it walks the interface table, the bridge (forwarding) table and the ARP cache, and correlates them into one row per physical port.
The output table carries:
Switch Port Mapper columns Column What it tells you Interface Index / Name / Description The SNMP ifIndex and the port as the switch names it — 2/14,10/100 utp ethernet (cat 3/5).Interface Alias The description someone configured on the port. Empty here is a documentation gap worth closing. Admin Status / Operational Status Configured state versus actual link state. Admin up + operational down is an unused or faulty port. Port Speed Negotiated speed. A 10 Mbps figure on a gigabit switch means a duplex or cabling fault. Type of Interface Physical ethernet, VLAN interface ( propVirtual), or management port.TrunkPort Whether the port is a trunk — which is how you tell an uplink from an access port. The header line confirms which device was polled and where the ARP data came from — Port Map for 10.199.4.13, ARP Info from device 0.199.4.13 — because on a layer-2 switch the ARP table usually has to be read from the router instead.
Export the result and you have a cabling document that was not typed by hand. Re-run it after every patching session and diff it: that is change control for the physical layer.
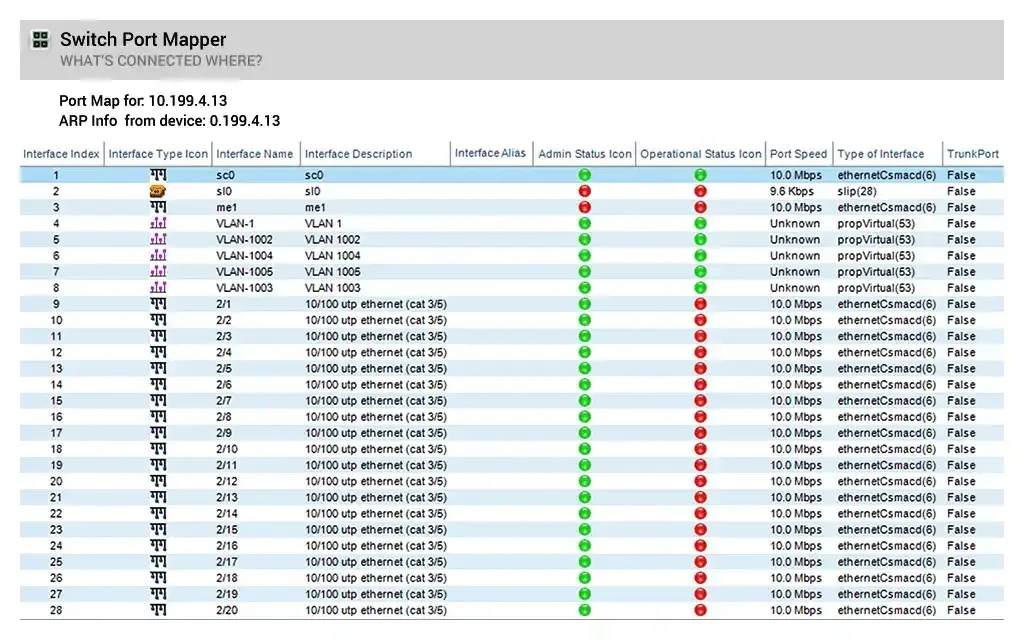
Switch Port Mapper: every port, its VLAN, speed, status and trunk flag. Screenshot: solarwinds.com. The classic workflow.Ping Sweep gives you the IP. MAC Address Discovery turns the IP into a MAC. Switch Port Mapper turns the MAC into a port. Three tools, five minutes, and you know which wall socket to unplug — without walking the floor.
-
4. MIB Scanner and MIB Browser — SNMP at range and at depth
MIB Scanner does one OID across many devices. Enter an IP range and an OID (
1.3.6.1.2for a general system walk), choose whether to match all OID instances or only specific ones, and press Discover. Each row returns the IP, the OID, the SNMP credential used and the value.Pointed at
sysDescr, this is the fastest inventory of firmware and OS versions you will get: the value column fills with strings like Hardware: Intel64 Family 6 Model 45 … Software: Windows Version 6.1 (Build 7601) and Linux lamp 3.2.0-4-amd64 #1 SMP Debian. Two tabs separate All devices from Devices matching the requested OIDs, and Export results writes the lot out.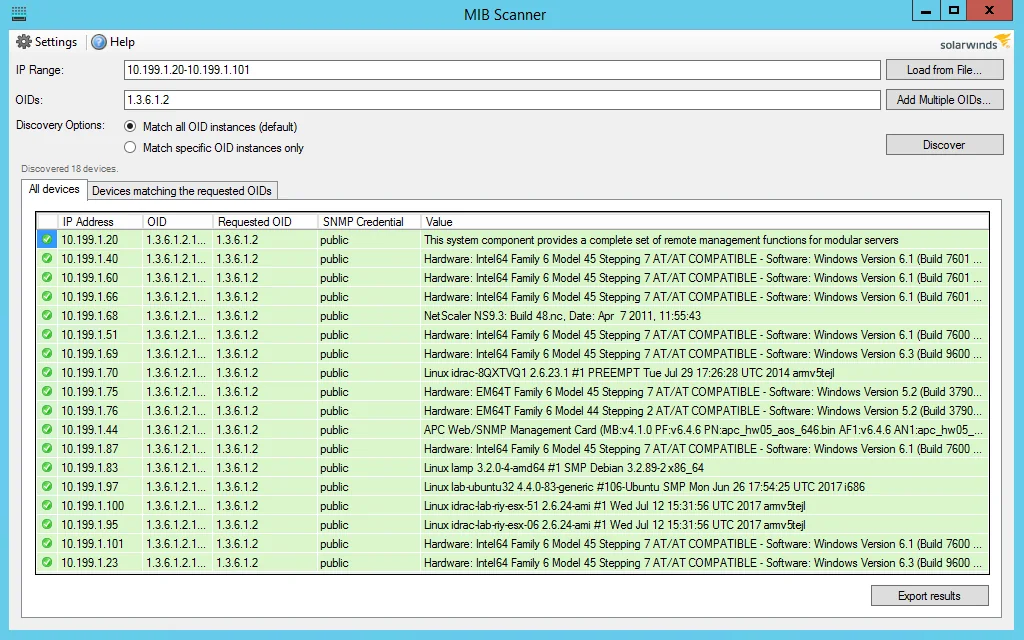
MIB Scanner: one OID, eighteen devices, firmware strings in the Value column. Screenshot: solarwinds.com. MIB Browser is the opposite: one device, every OID. It presents the loaded MIB tree — vendor branches and all — and lets you Get or Walk any node, set a drag format, bookmark an OID you use often, or export the table to Net-SNMP format. When a monitoring system needs to poll something unusual, this is where you find the OID that returns it.
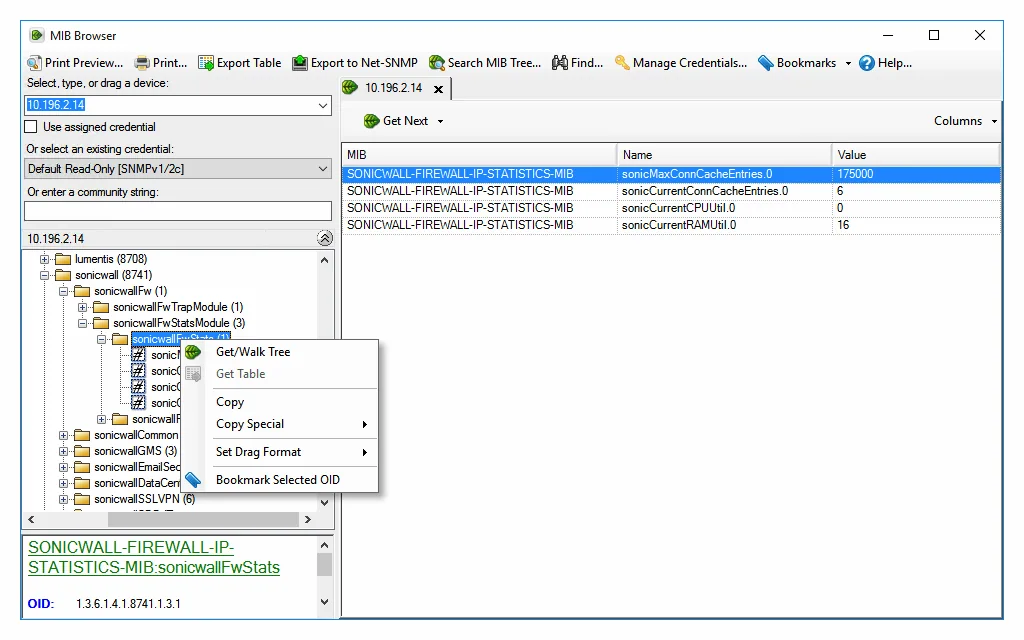
MIB Browser walking a vendor MIB tree, with the resolved OID shown at the bottom. Screenshot: solarwinds.com. -
5. TraceRoute — the path, with context
Subtitled Find ICMP path. Enter a hostname or IP and press Trace. What separates it from the
tracertbuilt into Windows is the extra columns: alongside hop number, IP and DNS you get Response Time, Up Time, Last Boot, Location and Description.Where the hop is one of your own SNMP-reachable devices, those columns fill in — 217 days 19 hours 12 minutes, Cisco 2821, ISP — so a trace doubles as a check that the router in the path has not rebooted recently. Beyond your edge the extra columns empty out and you are back to plain hop latency, with Request timed out rows where a hop declines to answer ICMP.
Timed-out hops are usually normal.Many carrier routers rate-limit or drop ICMP TTL-exceeded messages. A gap in the middle of a trace that still reaches the destination is not a fault.
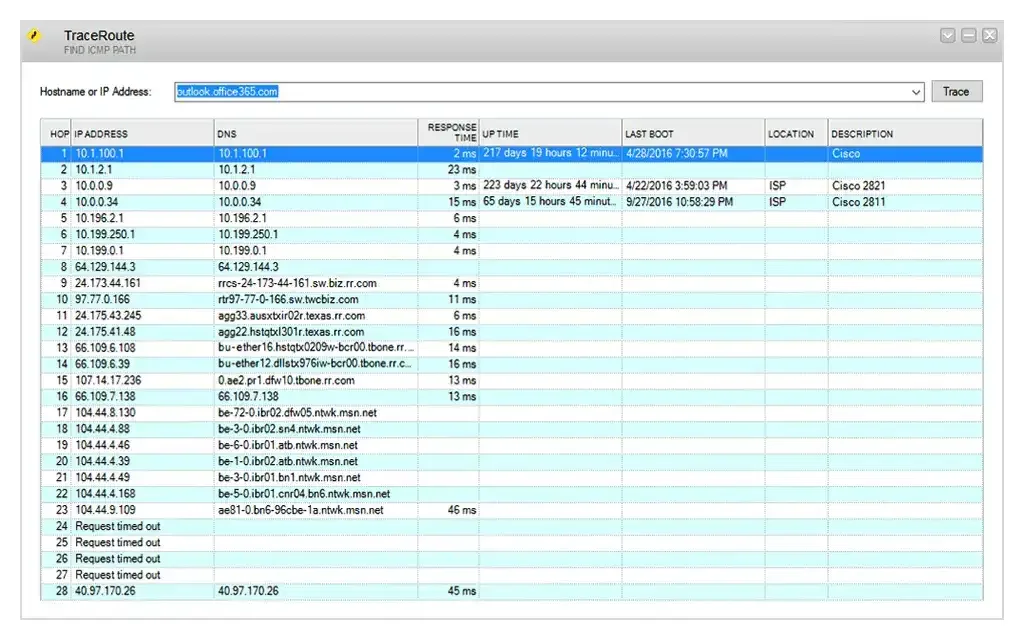
TraceRoute with uptime, last boot and device description per hop. Screenshot: solarwinds.com.
Other utilities worth knowing
The launchpad holds around sixty tools. Beyond the five above, these come up most often in day-to-day work:
WAN Killer
A traffic generator. Set a target, protocol, port, packet size and a percentage of circuit bandwidth, and it floods the link on purpose — the way you prove a QoS policy works before users do it for you.
Port Scanner & Proxy Sniffer
Service discovery across a range, for when you need to know what is listening rather than merely what is alive.
Config Editor / Uploader
Pulls running configurations off multiple devices over SNMP or TFTP and pushes them back — bulk change and backup without a full NCM deployment.
DNS Analyzer & DNS Audit
Resolves a zone from several angles and flags records that disagree — the fast way to find the stale A record behind an intermittent fault.
Response Time Monitor
Short-term latency and availability graphing for a handful of devices while you are actively troubleshooting.
SNMP Trap & Syslog receivers
Temporary collectors that let you watch what a device is actually emitting while you reproduce a problem.
FAQ
Is Engineer's Toolset the same as Network Performance Monitor?
No. Engineer's Toolset is a desktop bundle of on-demand utilities run by an engineer. Network Performance Monitor is a continuously polling server platform. They are separate SolarWinds products with separate licences.
Do I need SNMP for all of it?
No. Ping Sweep, MAC Address Discovery, TraceRoute and the ping/DNS tools work without SNMP. Switch Port Mapper, MIB Browser and MIB Scanner need SNMP read access on the target device.
Is there a free version?
No. It is a commercial product sold per engineer, with a time-limited free trial downloadable from solarwinds.com.
Can it replace a free scanner for simple jobs?
It can, but it does not need to. Most engineers keep Angry IP Scanner on a USB stick for the ten-second answer and open the Toolset when the question involves SNMP, switch ports or a path across the WAN.
See how these tools fit together into a repeatable process in how to map a local network, or check the three-way comparison before you buy.